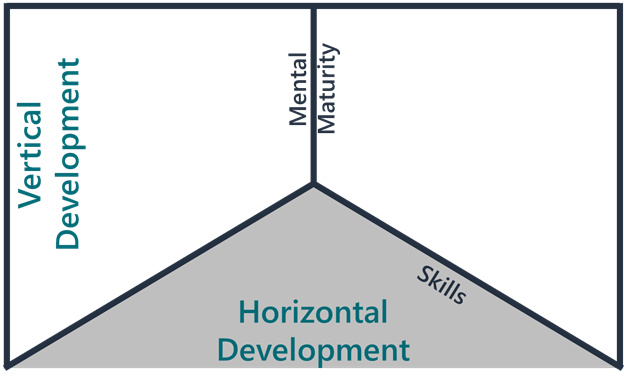
When I talk about the difference between horizontal and vertical development, I generally present the following figure as a way to depict their different foci:

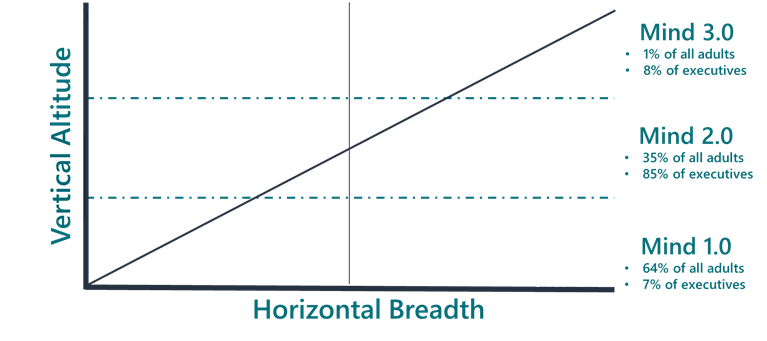
I was recently challenged by two colleagues to try to create a figure with horizontal development on the X axis and vertical development on the Y Axis like so:

The motivation for doing so is that it may better allow:
- Individuals to better identify where they are currently at on their personal development journey
- Organizational leaders to assess where their employees primarily reside and where and how they want to invest in their development.
Working Draft
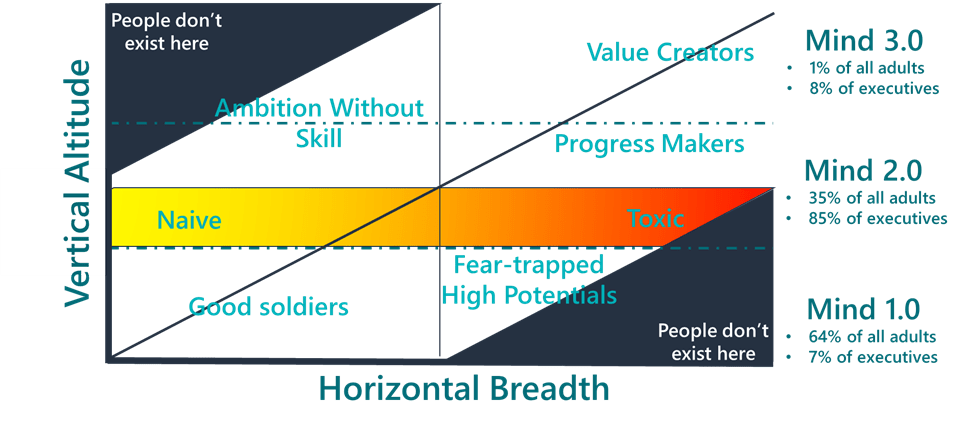
I am developing a working draft (thus I am open to your input), and here is what I have come up with:

If I am a CEO or executive of an organization, I should assume that my workforce likely breaks down as follows (going off of the percentage of “all adults” who fall into each mind level):
Mind 1.0 Level
- 50% are Good Soldiers – These are employees that have little horizontal knowledge and skill and little vertical development. These employees largely approach work as a means to get a pay check. They are fine being told what to do provided that they are provided with safety, comfort, and belonging.
- 14% are Fear-trapped High Potential – These are employees that have horizontal knowledge and skill, but they struggle to make meaningful use of their knowledge and skill because of limiting self-beliefs. These are often seen as high potentials with low-confidence.
Mind 2.0 Level
There are four types of employees here. Commonly, these are the executives, leaders, and managers in an organization. One of the things that I have learned working with and coaching leaders is that employees on the bottom-half of the Mind 2.0 level have the potential to be disruptive in an organization. Often, they are incredibly driven and self-focused. Employees on the top-half of the Mind 2.0 level are also incredibly driven, but they are more other-focused.
- 10% are Naive – These are employees that don’t have much knowledge and skill, but they are strongly driven to reach goals. Unfortunately, they don’t have the knowledge and skill to be very successful, and are often frustrated that their hard work isn’t paying off.
- 8% are Toxic – These are employees that are commonly seen as disruptive star performers. They have an incredible amount of knowledge and skill and are able to bring about great results, but they are generally a terrible teammate.
- 7% possess Ambition Without Skill – These are employees that are great team players, but they don’t have a high degree of knowledge or skill.
- 10% are Progress Makers – These are employees that are strongly driven to reach goals and are good team players. These are generally the executives in an organization.
Mind 3.0 Level
- 1% are Value Creators – These are employees that operate at the Mind 3.0 level and have significant horizontal breadth. They are generally able to have a huge positive influence on their organization. My belief is that making the shift from a Progress Maker to a Value Creator is one of the most important and meaningful shifts someone can make in their career.
Implications
Here are some of the implications that I think could come out of this figure:
- It would help me personally identify where I am at and what type of development I need
- It would help me identify where different groups of employees are and what type of development they need
- It might make me inclined to more clearly identify the value creators and progress makers in the organization
- It would make me interested in identifying the people who think they are more developed (in either or both dimensions) than what they really are
Seeking Your Feedback
As I mentioned, the figure above is a draft and it needs some work (it looks like a hot mess, and I am working on getting a graphic designer). But, I would be interested in your feedback on a few things:
- Does this make sense to you?
- Is it helpful to you? If so, what is helpful about it?
- If it isn’t helpful to you, is there anything that could be changed to make it more helpful?
- How do you think it could be improved?
So, if you are willing to provide feedback, I would be very grateful. I think the best ways to provide the feedback are by commenting on the post below or sending me an email: ryan@ryangottfredson.com.


2 Responses
I really like the overall organization of this graph. It is a helpful framework for assessing employee status. It would be really powerful if paired with evaluating mechanisms for determining where an employee sits on the skills versus mental capacity and maturity. If we could have ejected we evaluate where they fit into this graph then I would be more confident and using it to help people move forward.
Thank you! Evaluation would be very helpful. I am developing a vertical development assessment, but I don’t have a horizontal development assessment.